Find region neighbors
region-neighbors.RdThis function allows you to automatically identify neighbors of a selected region.
Usage
RegionNeighbors(object, ...)

# Default S3 method
RegionNeighbors(
  object,
  spots,
  mode = c("outer", "inner", "inner_outer", "all_inner_outer"),
  verbose = FALSE,
  ...
)

# S3 method for class 'Seurat'
RegionNeighbors(
  object,
  column_name,
  column_labels = NULL,
  mode = c("outer", "inner", "inner_outer", "all_inner_outer"),
  column_key = NULL,
  verbose = TRUE,
  ...
)
Arguments
- object
An object
- ...
Arguments passed to other methods
- spots
A character vector with spot IDs present in `spatnet`
- mode
Select mode (see details)
- verbose
Print messages
- column_name
string specifying a column name in your meta data with labels, e.g. clusters or manual selections
- column_labels
character vector with labels to find nearest neighbors for. These labels need to be present in the meta data columns specified by
column_name- column_key
prefix to columns returned in the Seurat object
Seurat
If a Seurat object is provided, the RegionNeighbors takes a meta
data column (chosen with column_name) with categorical labels,
finds the nearest neighbors of spots for a selected group in this columns
(chosen with column_labels) and returns new meta data column with
labels for the nearest neighbors of the selected group. If no column_labels
are specified, the method will return a column for each separate category in
the column_name vector.
Note that the prefix to the returned column names will be selected based on the mode.
You can overwrite this behavior by manually setting column_key.
Below is some additional information about the behavior of different modes:
return outer border (default):
mode="outer"return inner border:
mode="inner"return inner and outer borders:
mode="inner_outer"return all selected spots and outer border:
mode="all_inner_outer"
default method
The default method takes a list of spatial networks generated with
GetSpatialNetwork together with a vector of spot IDs
and returns the spot IDs for border spots. The behavior for border
spot selection is determined by the mode.
See also
Other spatial-methods:
CorSpatialFeatures(),
CutSpatialNetwork(),
DisconnectRegions(),
GetSpatialNetwork(),
RadialDistance(),
RunLabelAssortativityTest(),
RunLocalG(),
RunNeighborhoodEnrichmentTest()
Examples
library(semla)
library(dplyr)

se_mbrain <-
  readRDS(system.file("extdata",
  "/mousebrain/se_mbrain",
  package = "semla"))

# Create Seurat object
se_mbrain <- se_mbrain |>
  ScaleData(verbose = FALSE) |>
  RunPCA(verbose = FALSE) |>
  FindNeighbors(verbose = FALSE) |>
  FindClusters(verbose = FALSE)

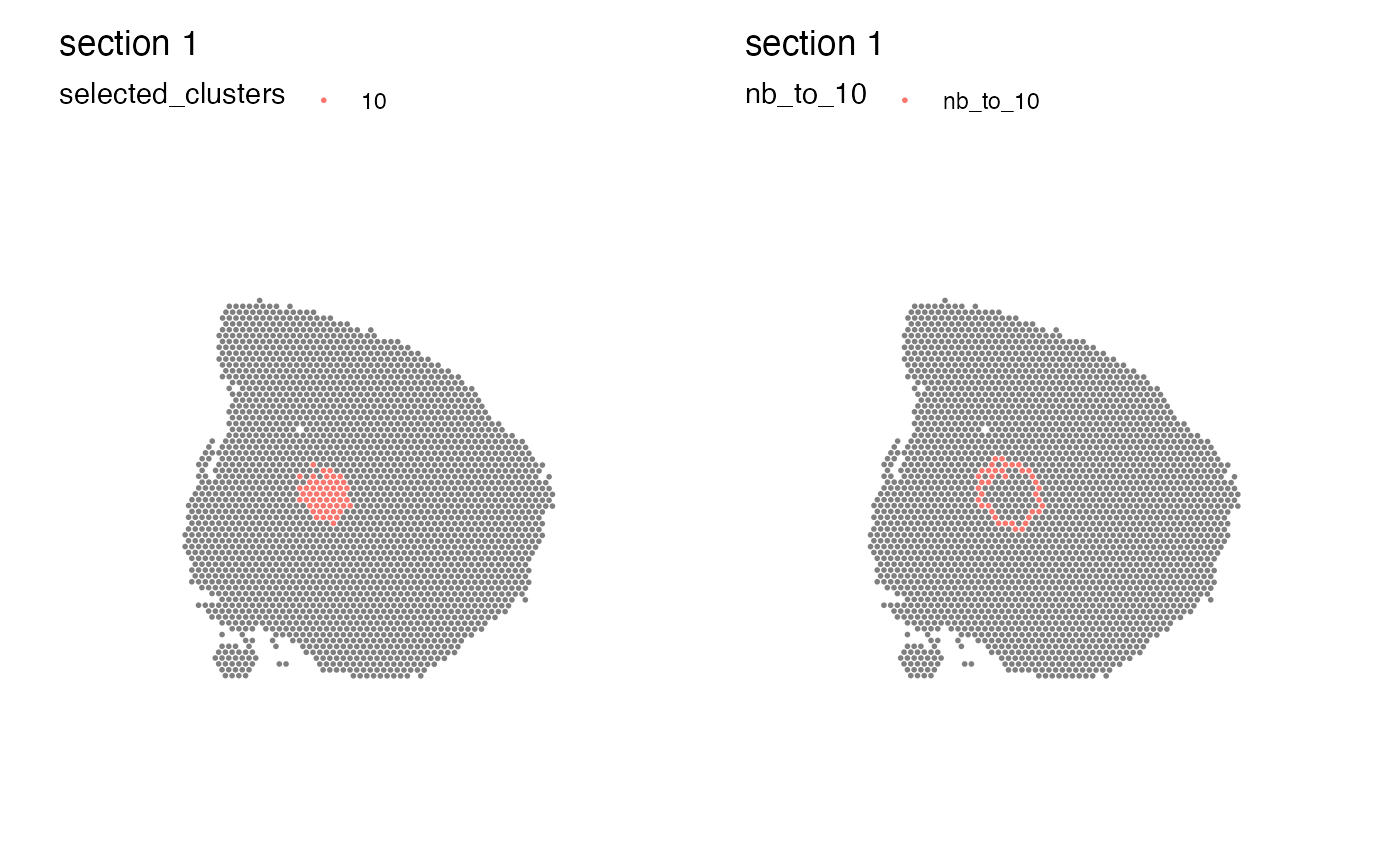
# Find neighbors to cluster 10
se_mbrain <- RegionNeighbors(se_mbrain,
                             column_name = "seurat_clusters",
                             column_labels = "10")
#> ℹ Finding neighboring spots for '10'
#> →   Excluding neighbors from the same group
#> →   74 neighbors left
#> →   Returning neighbors

# Plot cluster 10 and its neighbors
se_mbrain$selected_clusters <- se_mbrain[[]] |>
  mutate(across(where(is.factor), as.character)) |>
  mutate(cl = case_when(seurat_clusters %in% "10" ~ seurat_clusters,
                        TRUE ~ NA_character_)) |>
  pull(cl)

MapLabels(se_mbrain, column_name = "selected_clusters") |
  MapLabels(se_mbrain, column_name = "nb_to_10")


# \donttest{
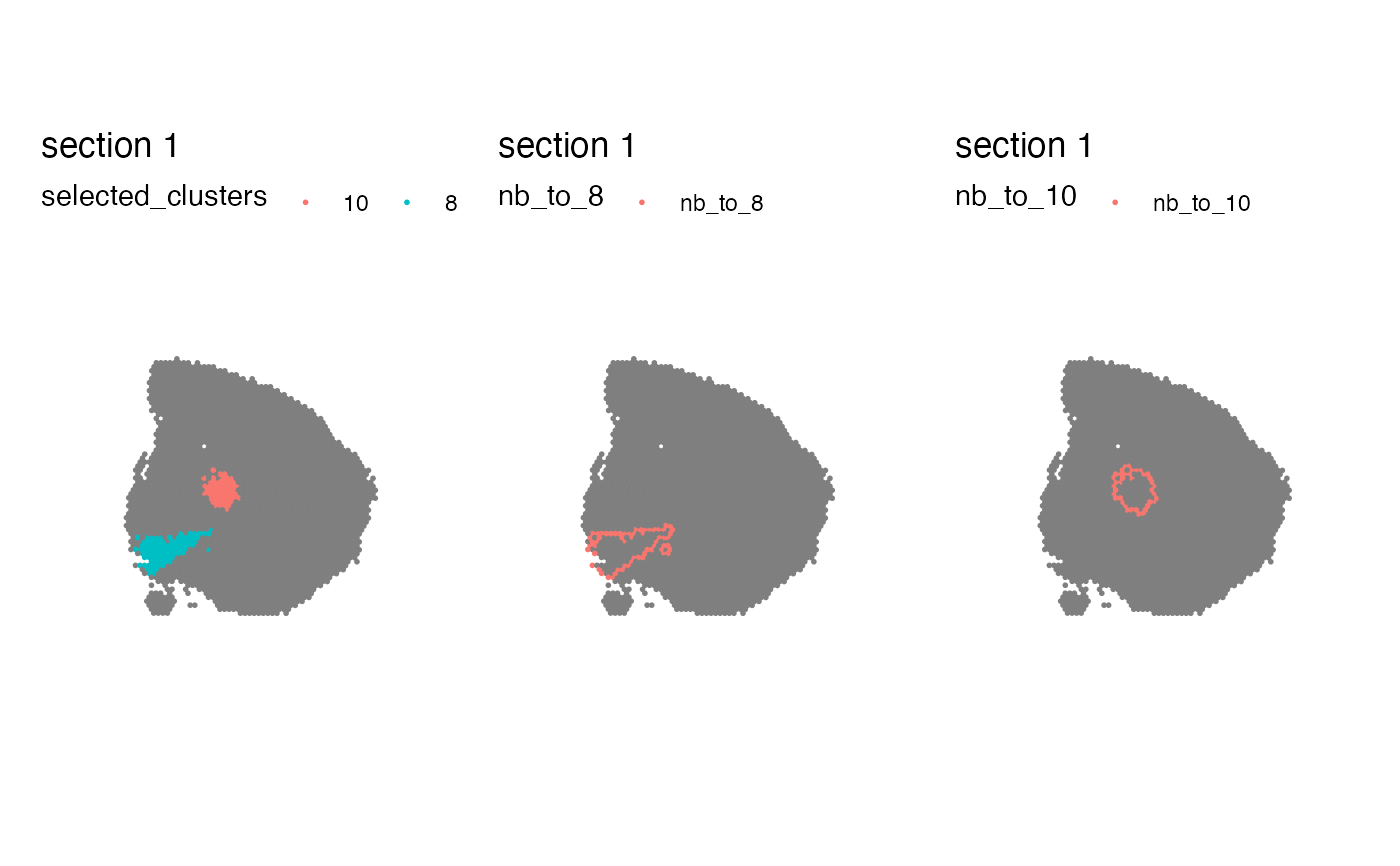
# Find neighbors to clusters 8 and 10
se_mbrain$selected_clusters <- se_mbrain[[]] |>
  mutate(across(where(is.factor), as.character)) |>
  mutate(cl = case_when(seurat_clusters %in% c("8", "10") ~ seurat_clusters,
                        TRUE ~ NA_character_)) |>
  pull(cl)
se_mbrain <- RegionNeighbors(se_mbrain,
                             column_name = "seurat_clusters",
                             column_labels = c("8", "10"))
#> ℹ Finding neighboring spots for '8'
#> →   Excluding neighbors from the same group
#> →   112 neighbors left
#> →   Returning neighbors
#> ℹ Finding neighboring spots for '10'
#> →   Excluding neighbors from the same group
#> →   74 neighbors left
#> →   Returning neighbors

# Plot cluster 8, 10 and its neighbors
library(patchwork)
MapLabels(se_mbrain, column_name = "selected_clusters") +
  MapLabels(se_mbrain, column_name = "nb_to_8") +
  MapLabels(se_mbrain, column_name = "nb_to_10") +
  plot_layout(design = c(area(1, 1, 1, 1),
                         area(1, 2, 1, 2),
                         area(1, 3, 1, 3)))


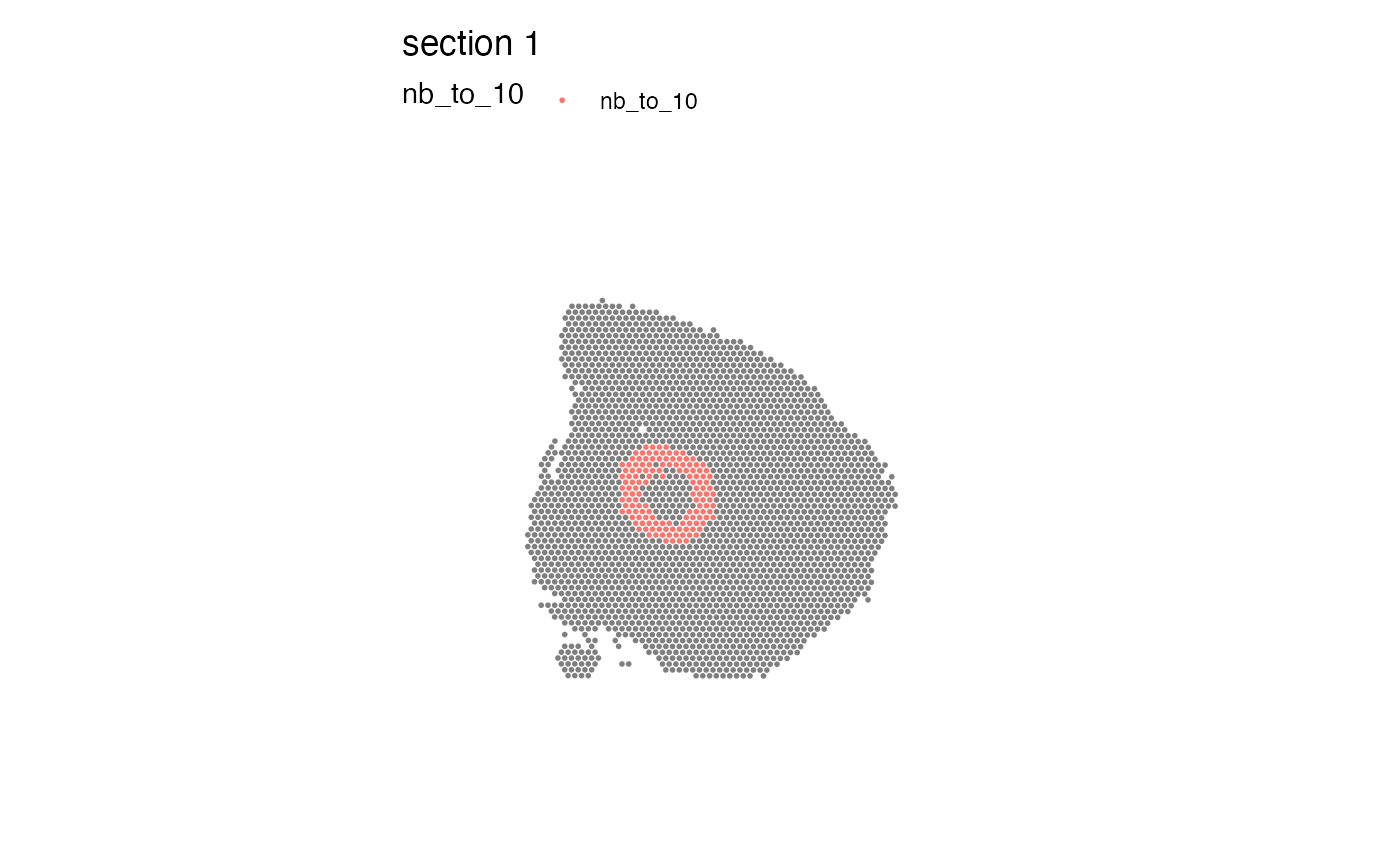
# it is also possible to pass additional parameters to GetSpatialNetwork
# to make it find more neighbors at a larger distances
se_mbrain <- RegionNeighbors(se_mbrain,
                             column_name = "seurat_clusters",
                             column_labels = "10",
                             nNeighbors = 40,
                             maxDist = Inf)
#> ℹ Finding neighboring spots for '10'
#> →   Excluding neighbors from the same group
#> →   860 neighbors left
#> →   Returning neighbors
MapLabels(se_mbrain, column_name = "nb_to_10")

# }
# }