Get started
Last compiled: 20 March 2026
getting_started.rmdsemla is a toolbox for processing, analysis and
visualization of spatially resolved transcriptomics data.
Installation
To install semla, run the following command from R:
remotes::install_github("ludvigla/semla")Load libraries
Load data
Currently, semla exclusively supports 10x Visium data.
The easiest way to load data is to use the ReadVisiumData()
function. First, you need a couple of files output by the 10x Genomics
Space
Ranger command line tool. These files are then assembled into a
data.frame-like object with one sample per row that can be
used by ReadVisiumData().
samples: file paths to expression matricesimgs: file paths to H&E imagesspotfiles: file paths to spot coordinate tablesjson: file paths to scale factor json files
We can also add any number of columns to our infoTable
which will be passed as meta data columns in our Seurat
object. This can for example be useful when you want to add clinical
metadata, experimental information etc. The example data below is from
two Visium data sets, one mouse brain and one mouse colon data set. Here
we add a sample_id column describing what tissue type we
have.
data_root_directory <- file.path(system.file("extdata", package = "semla"), "*")

samples <- Sys.glob(paths = file.path(data_root_directory,
                                      "filtered_feature_bc_matrix.h5"))

imgs <- Sys.glob(paths = file.path(data_root_directory,
                                   "spatial", "tissue_lowres_image.jpg"))

spotfiles <- Sys.glob(paths = file.path(data_root_directory,
                                        "spatial", "tissue_positions_list.csv"))

json <- Sys.glob(paths = file.path(data_root_directory,
                                   "spatial", "scalefactors_json.json"))
infoTable <- tibble(samples, imgs, spotfiles, json, # Add required columns
                    sample_id = c("mousebrain", "mousecolon")) # Add additional column
Now we are ready to load the 10x Visium data into a
Seurat object:
se <- ReadVisiumData(infoTable)
se
## An object of class Seurat
## 188 features across 5164 samples within 1 assay
## Active assay: Spatial (188 features, 0 variable features)
## 1 layer present: countsYou can use most Seurat methods as long as they do not require
spatial information. It’s important to know that the Seurat
R package stores spatial information (such as H&E images and
coordinates) differently than semla, meaning that
Seurat functions such as SpatialFeaturePlot()
and FindSpatiallyVariableFeatures() will not work.
semla comes with it’s own suite of tools and methods that
you can learn more about in other tutorials.
If you need to access the spatial data, such as images and
coordinates, you can use the GetStaffli function on your
Seurat object.
spatial_data <- GetStaffli(se)The H&E images are only loaded when LoadImages is
called on the Seurat object.
se <- LoadImages(se)
ImagePlot(se)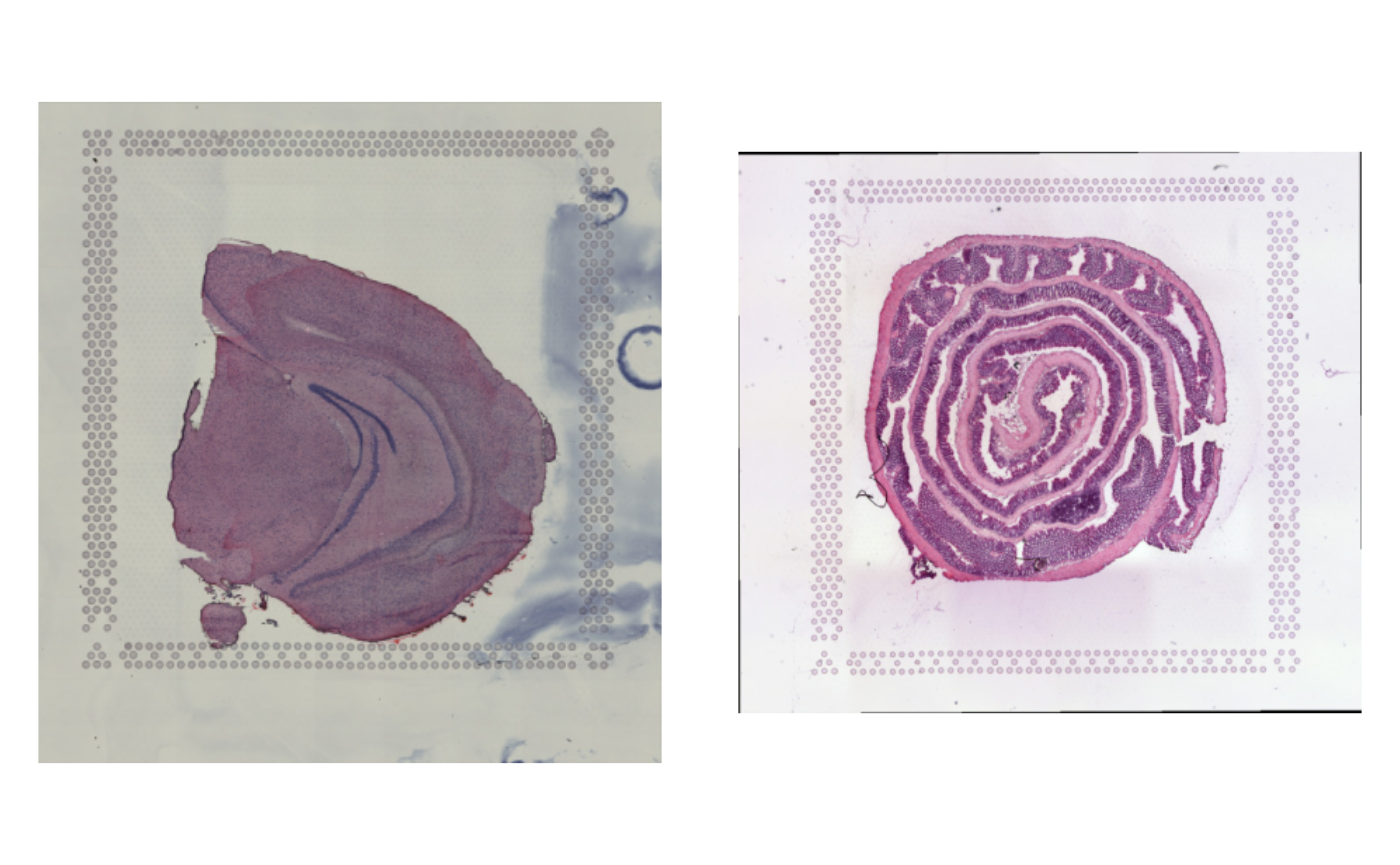
This should be enough to get you started with the rest of the tutorials!
NB: An important thing to know is that some generic functions, such
as subset and merge should not be used with
semla. Instead, use the SubsetSTData() and
MergeSTData() functions - See the vignette Subset/merge.
Make Seurat object compatible with semla
If you have a Seurat object with Visium data that was
prepared using Read10X_Image, it is possible to add a
Staffli object for compatibility with semla
using the UpdateSeuratForSemla function.
By doing so, you can now use both spatial visualization functions
from Seurat and semla.
InstallData("stxBrain")

# Load example Seurat object
brain <- LoadData("stxBrain", type = "anterior1")
# Make Seurat object compatible with semla
brain_semla <- UpdateSeuratForSemla(brain)
# Load H&E images
brain_semla <- LoadImages(brain_semla)
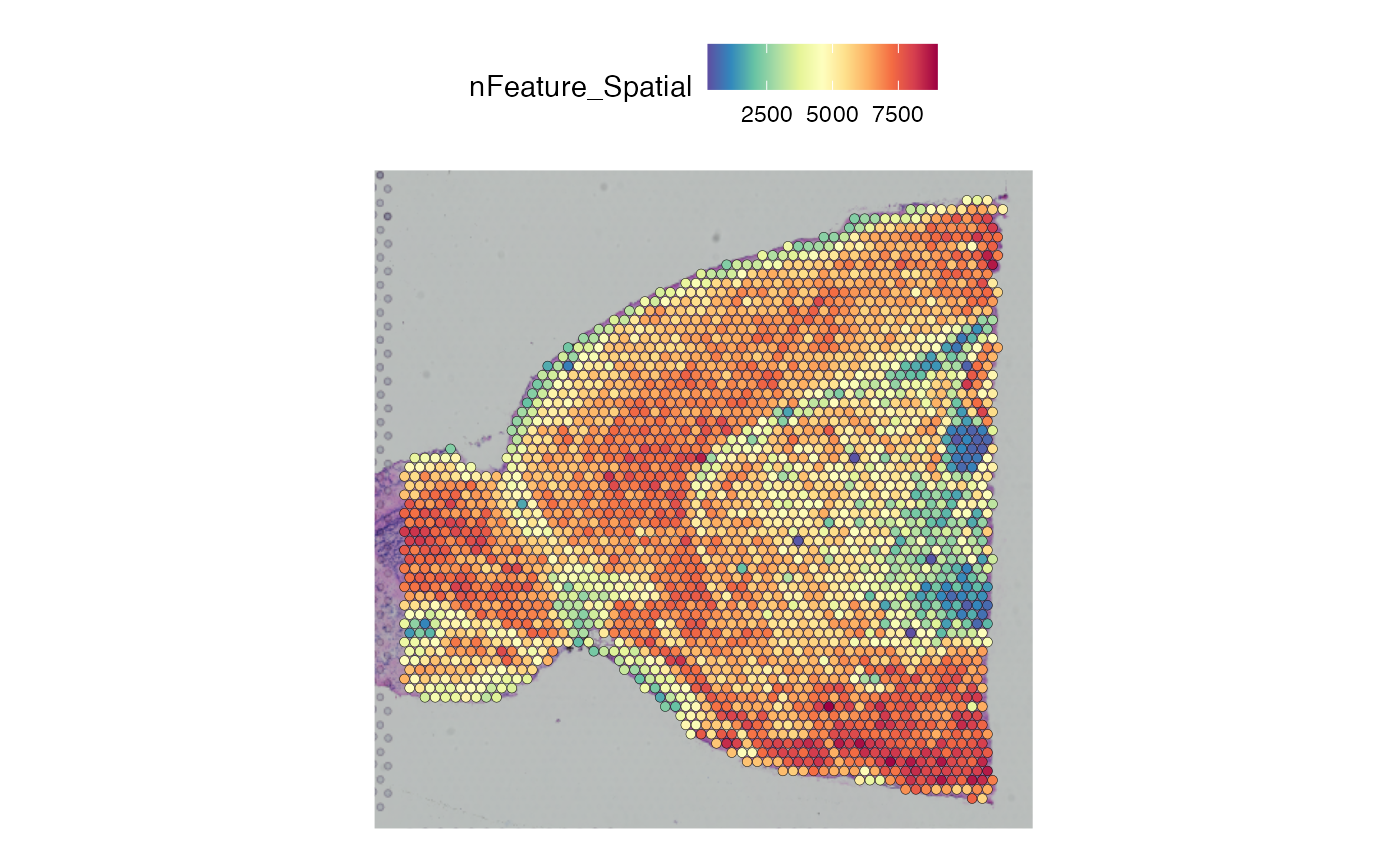
# Plot with semla
MapFeatures(brain_semla, features = "nFeature_Spatial",
image_use = "raw", override_plot_dims = TRUE) & ThemeLegendRight()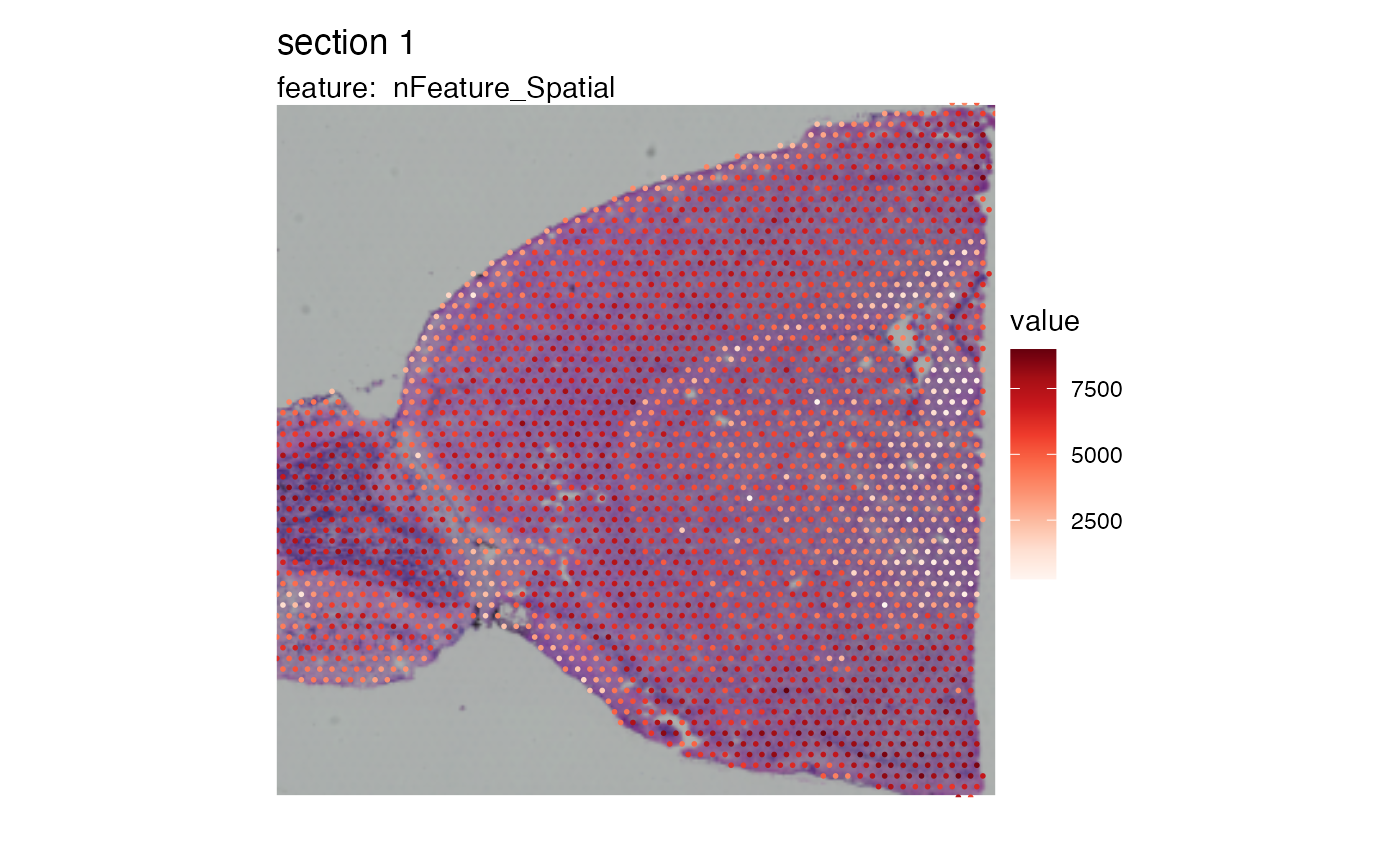
# Plot with Seurat
SpatialFeaturePlot(brain_semla, features = "nFeature_Spatial")