5.4 Spatial color projection
It is also possible to project the results of a UMAP onto our tissue sections. This can be a quick and useful way of identifying regions with similar gene expression profiles across multiple tissue sections.
We’ll use a neat trick here where we first run UMAP with 3 components, then we mix these three component values to produce an RGB color. This way we obtain a mixed color for each combination of UMAP components for each spot.
se.cor <- RunUMAP(object = se.cor, n.components = 3, reduction = "harmony", dims = 1:30, reduction.name = "umap.3d")ST.DimPlot(object = se.cor, dims = 1:3, reduction = "umap.3d", blend = TRUE, dark.theme = TRUE, pt.size = 1.8)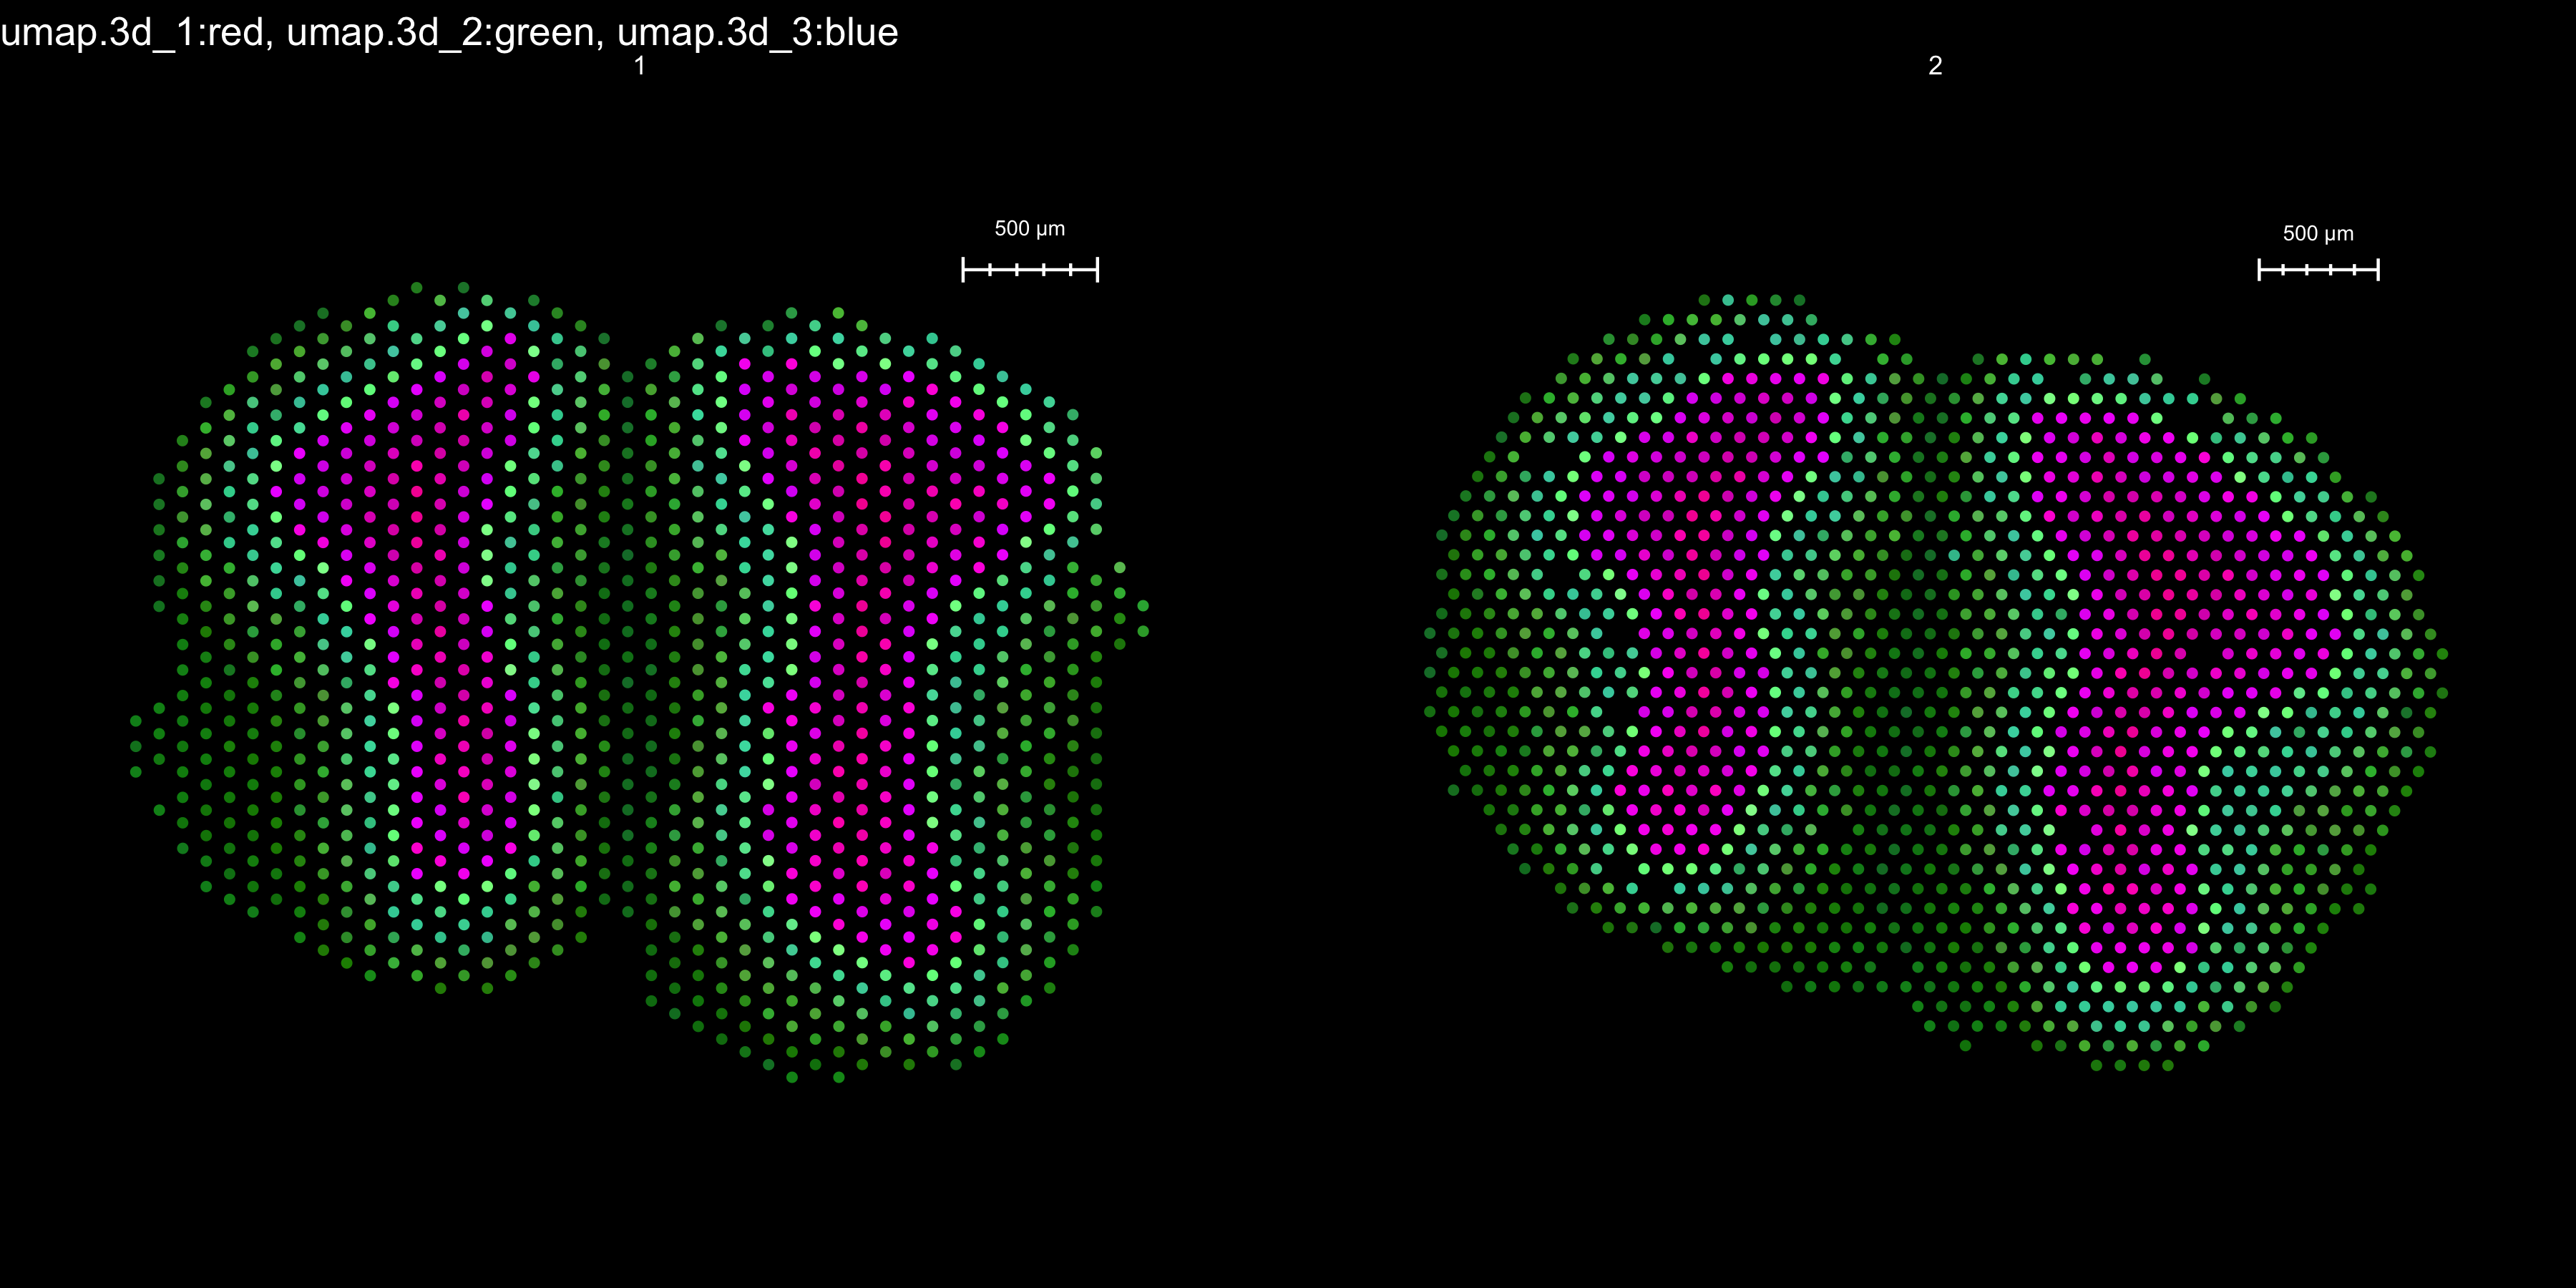
Figure 5.3: Spatial color projection of a 3D UMAP