4.2 Other metrics
It can also be useful to explore other features of the data set to use for filtering, for example mitochondrial transcript content or ribosomal protein coding transcript content. Mitochondrial genes are prefixed with “mt-” in MGI nomenclature so we can collect these genes and then calculate the percentage of mitochondrial content per spot and add this information to our meta.data.
se <- PercentageFeatureSet(se, pattern = "^mt-", col.name = "pct.mt")
se <- PercentageFeatureSet(se, pattern = "^Rpl|^Rps-", col.name = "pct.ribo")

col_samples <- c("#1954A6", "#A7C947")
p1 <- ST.FeaturePlot(se, features = c("pct.mt"), cols = col_scale, ncol = 2, pt.size = 1.5, show.sb = FALSE, label.by = "slide_id")
p2 <- VlnPlot(se, features = c("pct.mt"), group.by = "slide_id", cols = col_samples) & NoLegend()
p3 <- ST.FeaturePlot(se, features = c("pct.ribo"), cols = col_scale, ncol = 2, pt.size = 1.5, show.sb = FALSE, label.by = "slide_id")
p4 <- VlnPlot(se, features = c("pct.ribo"), group.by = "slide_id", cols = col_samples) & NoLegend()

(p1-p2) / (p3-p4) & patchwork::plot_layout(widths = c(2,1))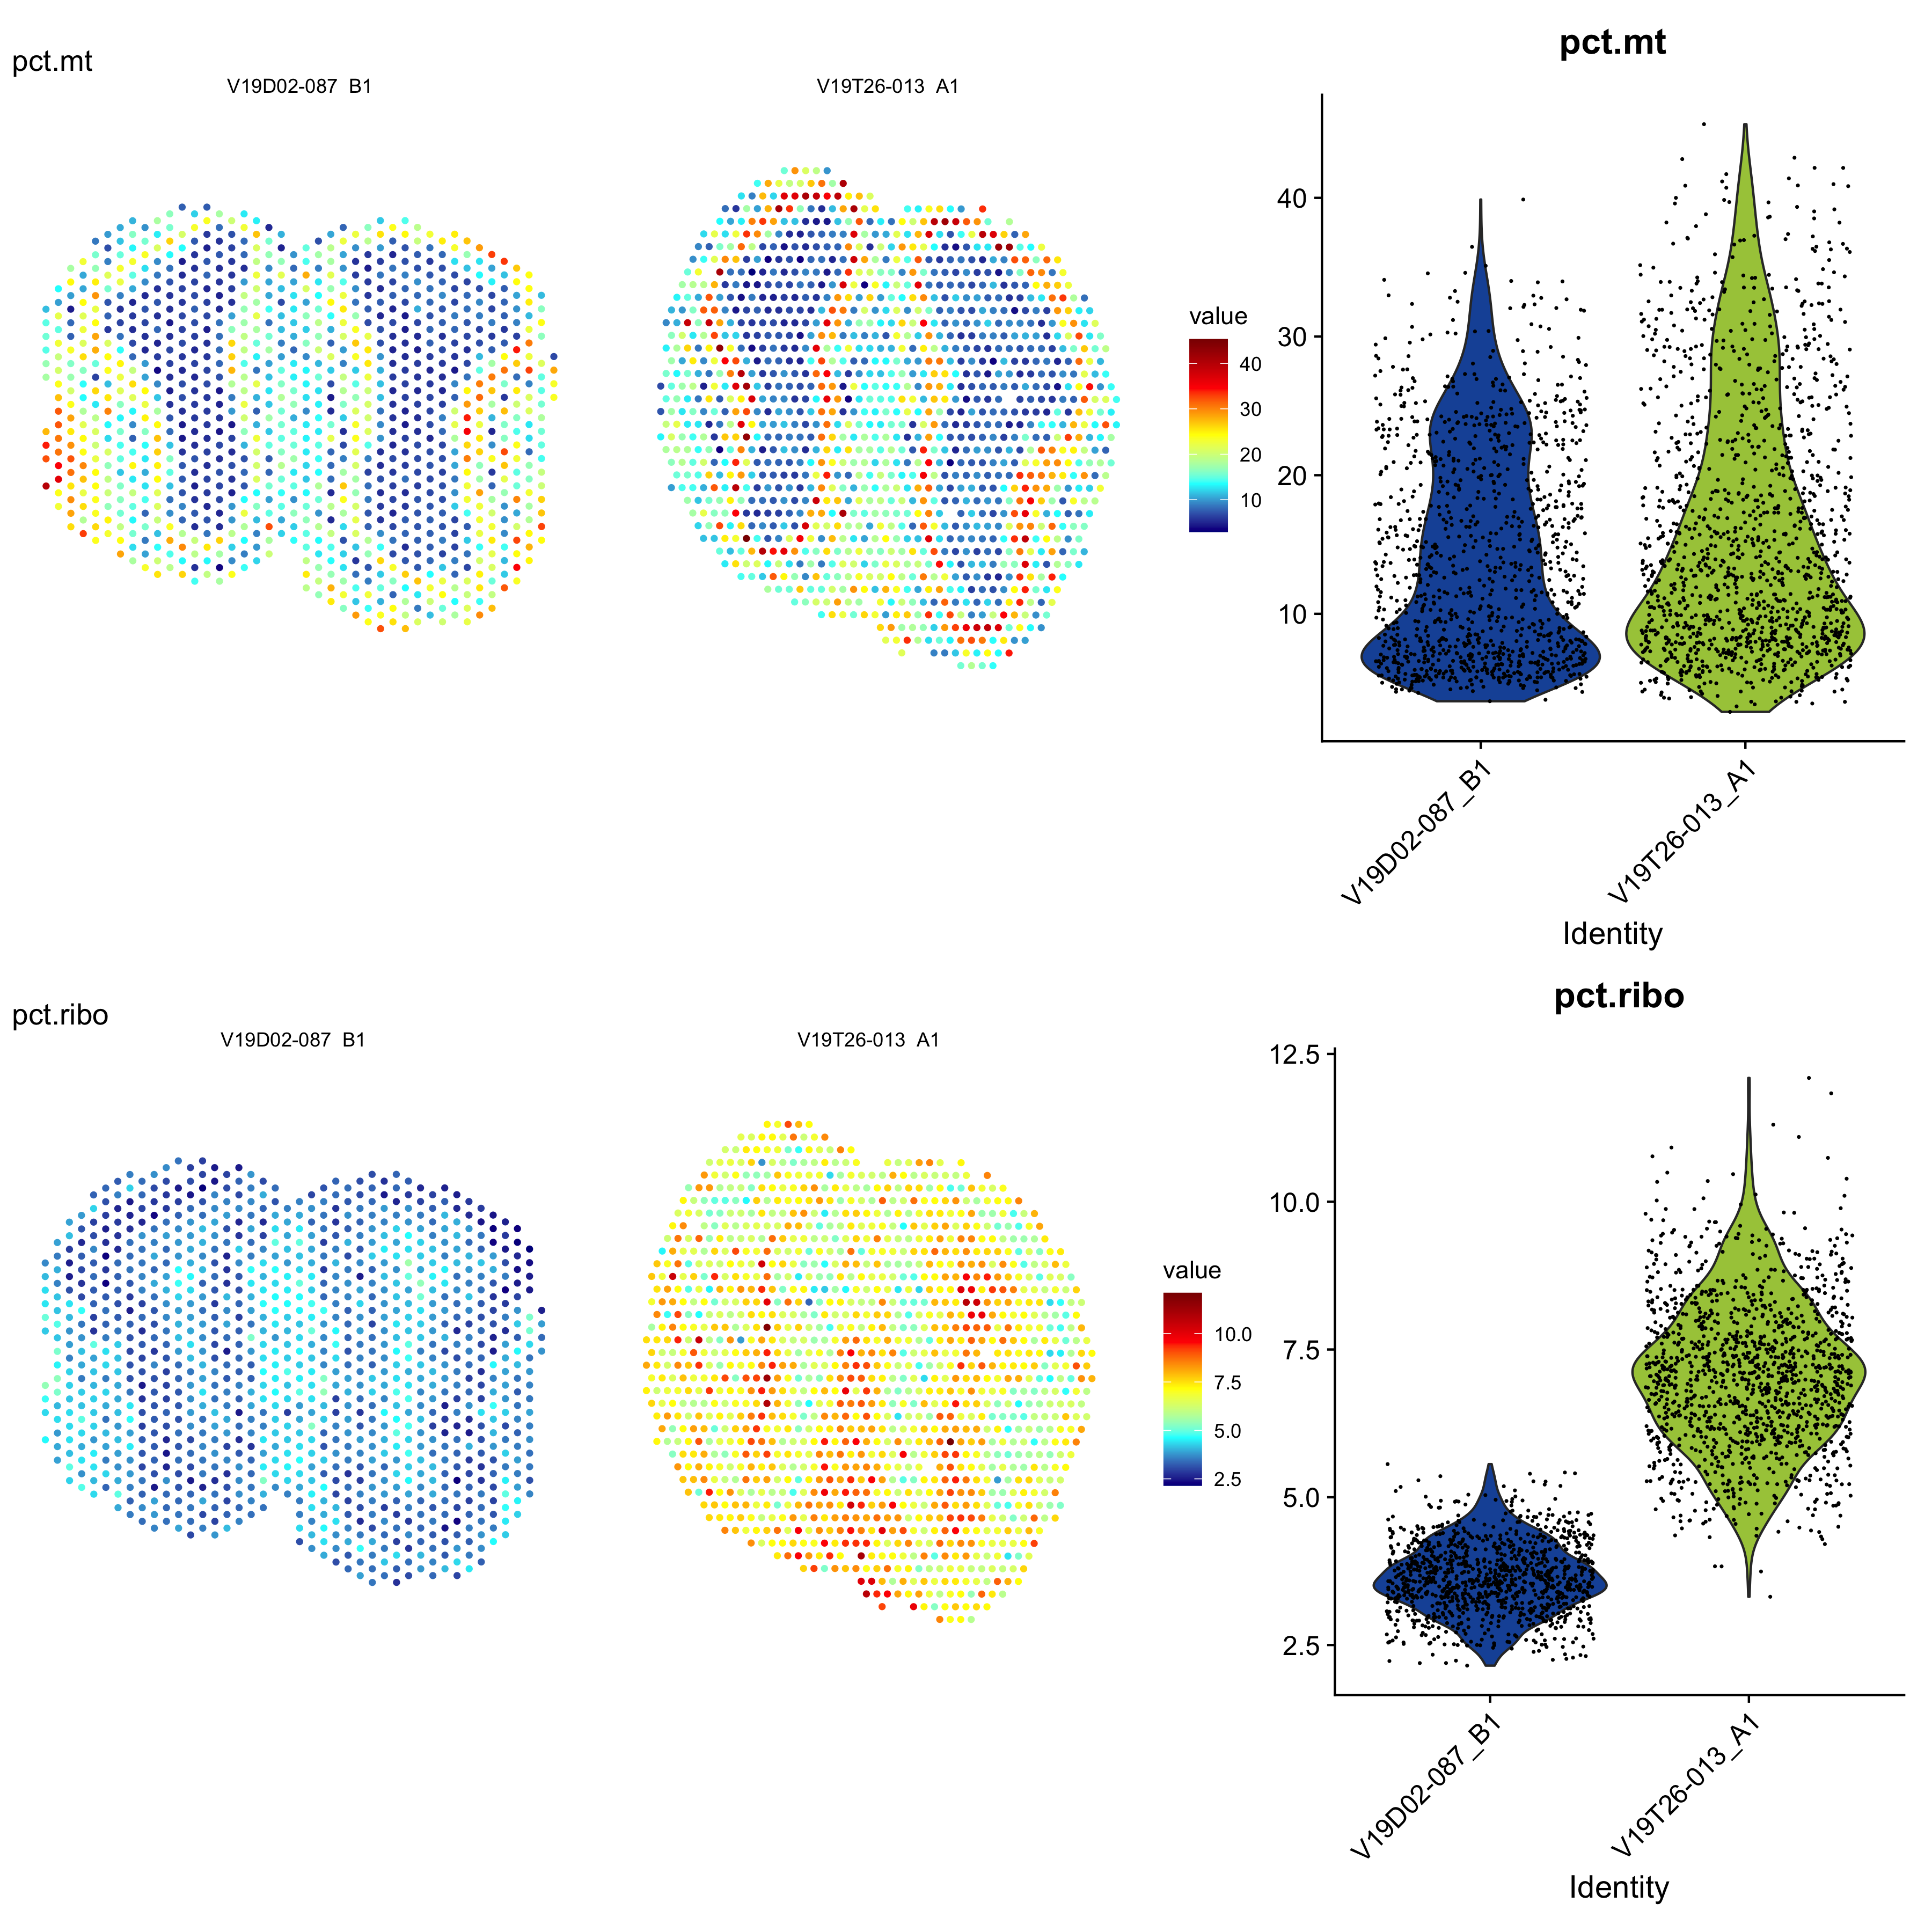
Figure 4.3: Mitochondrial transcript content and ribosomal protein coding transcript content.