5.3 Data integration
Sometimes, data integration techniques are necessary to perform a joint analysis of the data. Let’s try one of the most popular methods called Harmony. We’ll run this method on our corrected data to see if we can improve it even further. Good to keep in mind is that Harmony operates on the PC vectors, and not on the gene expression values.
library(harmony)
se.cor <- RunHarmony(se.cor, group.by.vars = "batch", assay.use = "SCT") %>%
  RunUMAP(reduction = "harmony", dims = 1:30, reduction.name = "umap.harmony")
p1 <- DimPlot(se.norm, reduction = "umap", group.by = "batch", cols = col_samples) + labs(title="A) No correction")
p2 <- DimPlot(se.cor, reduction = "umap", group.by = "batch", cols = col_samples) + labs(title="B) SCT batch correction")
p3 <- DimPlot(se.cor, reduction = "umap.harmony", group.by = "batch", cols = col_samples) + labs(title="C) SCT batch correction + Harmony")
p1 + p2 + p3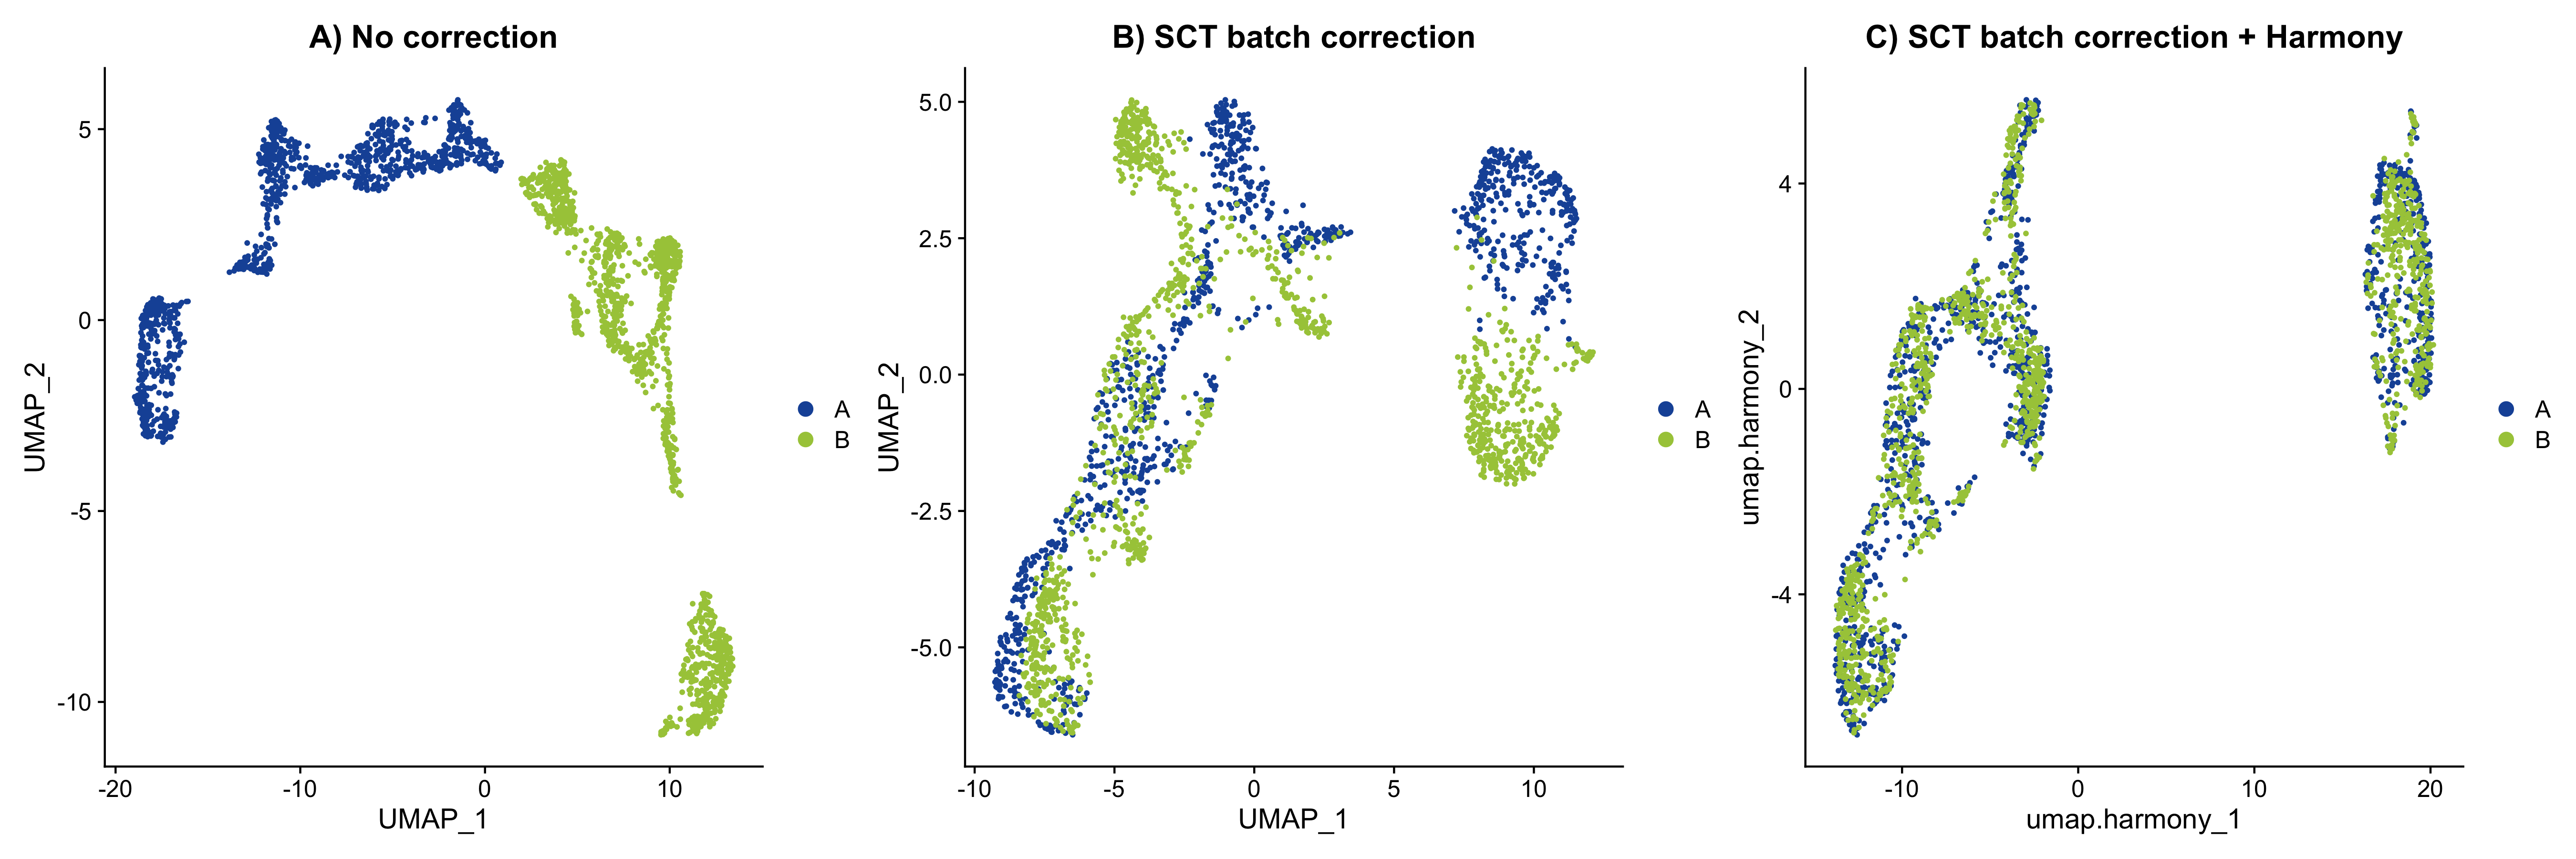
Figure 5.2: UMAP embedding of MOB data. A) No correction. B) Correction by regression. C) Correction by data integration
As you can see, we can integrate the data from our two sections pretty well using these approaches. Harmony seems to have helped align the data very well, and now we can use these harmonized vectors to continue with some downstream analyses instead.