About
Joseph Bergenstråhle, SciLifeLab, Royal Institute of Technology (KTH)
Ludvig Larsson, SciLifeLab, Royal Institute of Technology (KTH)
Last updated: 2022-02-28
Checks: 7 0
Knit directory: STUtility_web_site/
This reproducible R Markdown analysis was created with workflowr (version 1.7.0). The Checks tab describes the reproducibility checks that were applied when the results were created. The Past versions tab lists the development history.
Great! Since the R Markdown file has been committed to the Git repository, you know the exact version of the code that produced these results.
Great job! The global environment was empty. Objects defined in the global environment can affect the analysis in your R Markdown file in unknown ways. For reproduciblity it’s best to always run the code in an empty environment.
The command set.seed(20191031) was run prior to running the code in the R Markdown file. Setting a seed ensures that any results that rely on randomness, e.g. subsampling or permutations, are reproducible.
Great job! Recording the operating system, R version, and package versions is critical for reproducibility.
Nice! There were no cached chunks for this analysis, so you can be confident that you successfully produced the results during this run.
Great job! Using relative paths to the files within your workflowr project makes it easier to run your code on other machines.
Great! You are using Git for version control. Tracking code development and connecting the code version to the results is critical for reproducibility.
The results in this page were generated with repository version 64ae8be. See the Past versions tab to see a history of the changes made to the R Markdown and HTML files.
Note that you need to be careful to ensure that all relevant files for the analysis have been committed to Git prior to generating the results (you can use wflow_publish or wflow_git_commit). workflowr only checks the R Markdown file, but you know if there are other scripts or data files that it depends on. Below is the status of the Git repository when the results were generated:
Ignored files:
    Ignored:    .Rhistory
    Ignored:    analysis/.DS_Store
    Ignored:    analysis/manual_annotation.png
    Ignored:    pre_data/
Note that any generated files, e.g. HTML, png, CSS, etc., are not included in this status report because it is ok for generated content to have uncommitted changes.
These are the previous versions of the repository in which changes were made to the R Markdown (analysis/About.Rmd) and HTML (docs/About.html) files. If you’ve configured a remote Git repository (see ?wflow_git_remote), click on the hyperlinks in the table below to view the files as they were in that past version.
| File | Version | Author | Date | Message |
|---|---|---|---|---|
| html | d41bcb0 | Ludvig Larsson | 2022-02-28 | Build site. |
| html | 0dafcee | Ludvig Larsson | 2021-05-06 | Build site. |
| html | df62517 | Ludvig Larsson | 2021-05-06 | Build site. |
| html | 88b046f | Ludvig Larsson | 2021-05-05 | Build site. |
| html | 2523b70 | Ludvig Larsson | 2021-05-05 | Changed names of docs |
| Rmd | 363f911 | Ludvig Larsson | 2021-05-05 | Changed names of Rmds |
| Rmd | f3d1542 | Ludvig Larsson | 2019-10-31 | Start workflowr project. |
Background
STutility R-package is an effort to create a user-friendly infrastructure for analysis of spatial transcriptomcis data. The tool is built to work on top of Seurat, which is a popular single-cell genomics analysis toolkit.
Spatial Transcriptomics (ST)
Spatial Transcriptomics is a method that allows visualization and quantitative analysis of the transcriptome in thin tissue sections by combining gene expression data and microscopy based image data. The invention was first presented in science in 2016 and has since been commercialized by 10x Genomics. The method has received increasing attention and is currently the basis of several national and international collaborations and spatially resolved transcriptomics was recently awarded method of the year in 2020.
The schematic below gives a brief overview of the concept. An introductory animation is available on our website: http://www.spatialresearch.org/
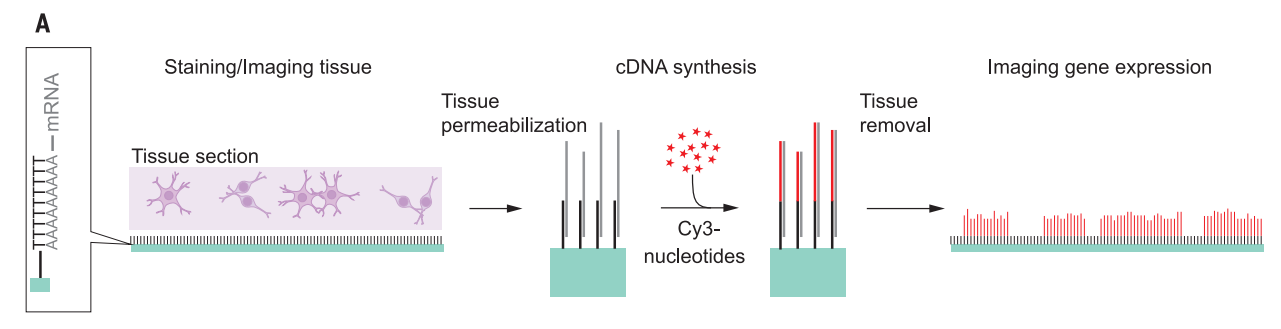
Schematic Spatial Transcriptomics
The first generation array featured 1000 capture-spots, each spot with a diameter of 100 µm. Accordingly, we refer this first generation array as the “1k” array in this tutorial and package parameters. Since the first generation array, the method has been developed to feature 2000 capture-spots (“2k” array) and 5000 spots (10x Visium).
10X Visium
This array features 5000 capture-spots, each with a diameter of 55µm printed in a hexagonal pattern. The array is available for commercial use.
Notes about the tool
“1k” and “2k” ST arrays
The gene expression data consists of a count matrix with genes in rows and “capture-spots” in columns. Each spot represents a small area on an ST array from which the captured transcripts have been barcoded with a unique sequence. The unique barcode makes it possible to map the transcripts onto a spatial position on the tissue section and would be equivalent to a cell specific barcode in scRNA-seq data but can tag a mixture of transcripts from multiple cells. The spatial position of a spot is an (x, y) coordinate that defines the centroid of the spot area. These spatial coordinates are stored in the spot ids (column names) and allows us to visualize gene expression (and other spot features) in the array grid system. However, if you want to overlay a visualization on top the HE image you want to make sure that the spot coordinates are exact in relation to morphological features of the image. When the spots are printed onto the ST array surface, they will sometimes deviate from the (x, y) coordinates given by the spot ids and should therefore be adjusted. In addition to the spot adjustment, you will also need to label the spots that are located directly under the tissue. Spot adjustment and selection can be done automatically using our ST spot detector web tool which outputs a table of adjusted coordinates and labels for the spots under tissue.
10X Visium arrays
10X Genomics provide the SpaceRanger command line tool to process raw data from an NGS instrument. With this tool, the spots under the tissue are automatically selected using a tissue detection algorithm so there’s usually no need to any manual alignment steps. However, sometimes the tissue detection fails in which case it is possible to do the alignment and spot selection manually with the Loupe browser desktop application.
Seurat workflow
The STutility package is designed to work on top of the popular single-cell genomics analysis toolkit Seurat. Although a spot represents an averaged expression profile from multiple cells, as opposed to a single-cell profile, the characteristics of the ST data resembles that of scRNAseq to a large extent with regards to count distributions and sparsity. Many of the analyses that have been developed for scRNA-seq data can therefore be directly applied to ST data as well.
Naming conventions
For users familiar with the Seurat workflow, there are two commonly used plotting functions available to draw feature expression in a 2D-embedding such as UMAP or t-SNE, namely FeaturePlot() and DimPlot. These two plotting functions are available in STutility where “ST.” is prefixed to the function name, but will instead draw feature expression in the spatial coordinate system.
A work by Joseph Bergenstråhle and Ludvig Larsson
sessionInfo()R version 4.0.3 (2020-10-10)
Platform: x86_64-apple-darwin13.4.0 (64-bit)
Running under: macOS Mojave 10.14.6
Matrix products: default
BLAS/LAPACK: /Users/ludviglarsson/anaconda3/envs/R4.0/lib/libopenblasp-r0.3.12.dylib
locale:
[1] en_US.UTF-8/en_US.UTF-8/en_US.UTF-8/C/en_US.UTF-8/en_US.UTF-8
attached base packages:
[1] stats graphics grDevices utils datasets methods base
other attached packages:
[1] workflowr_1.7.0
loaded via a namespace (and not attached):
[1] Rcpp_1.0.6 jquerylib_0.1.3 pillar_1.7.0 compiler_4.0.3
[5] bslib_0.2.4 later_1.1.0.1 git2r_0.28.0 tools_4.0.3
[9] getPass_0.2-2 digest_0.6.27 jsonlite_1.7.2 evaluate_0.14
[13] lifecycle_1.0.1 tibble_3.1.6 pkgconfig_2.0.3 rlang_1.0.1
[17] cli_3.1.1 rstudioapi_0.13 yaml_2.2.1 xfun_0.20
[21] httr_1.4.2 stringr_1.4.0 knitr_1.31 sass_0.3.1
[25] fs_1.5.0 vctrs_0.3.8 rprojroot_2.0.2 glue_1.4.2
[29] R6_2.5.0 processx_3.5.1 fansi_0.4.2 rmarkdown_2.7
[33] callr_3.7.0 magrittr_2.0.1 whisker_0.4 ps_1.6.0
[37] promises_1.2.0.1 ellipsis_0.3.2 htmltools_0.5.1.1 httpuv_1.5.5
[41] utf8_1.2.1 stringi_1.5.3 crayon_1.4.1